
Climate change has become one of the most important issues of the 21st century, particularly with regards to extreme weather, floods, and droughts in recent years, forcing government agencies, enterprises, and private organizations to consider mitigating risks and taking adaptive measures more proactively. Since its establishment, ITEQ has considered a low-carbon design and implemented energy management systems in its operations to reduce greenhouse gas (GHG) emissions.
Energy Policy
We establish an energy management system according to ISO 50001:2018. Also, we promise to implement and continually improve the following matters:
- Compliance with energy regulations and procurement of energy-saving products.
- Improvement of energy performance to enhance energy efficiency.
- Achievement of energy goals with participation of all employees in carbon reduction efforts.
- Implementation of an energy management system and build a sustainable enterprise.
- Continuous improvement of energy performance and the energy management system.

Energy Consumption and GHG Emission
Energy Consumption
| Category | Plant | 2022 | 2023 | 2024 | 2025 |
| Natural Gas (thousand cubic meters) | Taiwan | 1,909.17 | 2,285.76 | 2,982.28 | 3,718.16 |
| Wuxi | 6,094.79 | 5,350.13 | 5,737.78 | 6,009.28 | |
| Dongguan | 1,671.41 | 1,824.02 | 1,004.46 | 999.41 | |
| Guangzhou | 1,349.84 | 663.89 | 448.32 | 397.04 | |
| Jiangxi | 9,984.80 | 12,382.66 | 17,016.70 | 17,398.03 | |
| Total | 21,010.00 | 22,506.45 | 27,189.54 | 28,521.92 | |
| Electricity (kWh) | Taiwan | 17,486.40 | 16,920.80 | 18,991.20 | 21,812.00 |
| Wuxi | 52,694.40 | 48,492.10 | 53,159.14 | 57,456.80 | |
| Dongguan | 23,722.13 | 21,640.80 | 13,135.20 | 14,057.40 | |
| Guangzhou | 15,141.27 | 12,730.44 | 11,017.16 | 10,093.70 | |
| Jiangxi | 64,306.50 | 77,383.40 | 100,392.79 | 100,454.00 | |
| Total | 173,350.69 | 177,167.54 | 196,695.49 | 203,873.90 | |
| Diesel (Liters) | Taiwan | 52,790.61 | 39,567.62 | 39,648.54 | 30,895.89 |
| Wuxi | 256,452.00 | 292,965.65 | 309,043.65 | 328,696.74 | |
| Dongguan | 66,068.90 | 167,705.71 | 188,410.53 | 175,124.45 | |
| Guangzhou | 20,719.57 | 2,924.62 | 86.00 | 86.00 | |
| Jiangxi | Unused | Unused | 45,746.57 | 99,013.48 | |
| Total | 396,031.08 | 503,163.60 | 582,935.29 | 633,816.56 | |
| Total of categories (GJ) | 1,241,260.50 | 1,341,169.09 | 1,471,044.70 | 1,508,500.87 | |
Note: Heat conversion factor: 1kwh=3.6MJ; 1kcal=4,186.8 J.
GHG Emission
Emissions of Other Indirect Greenhouse Gases (Scope 3)
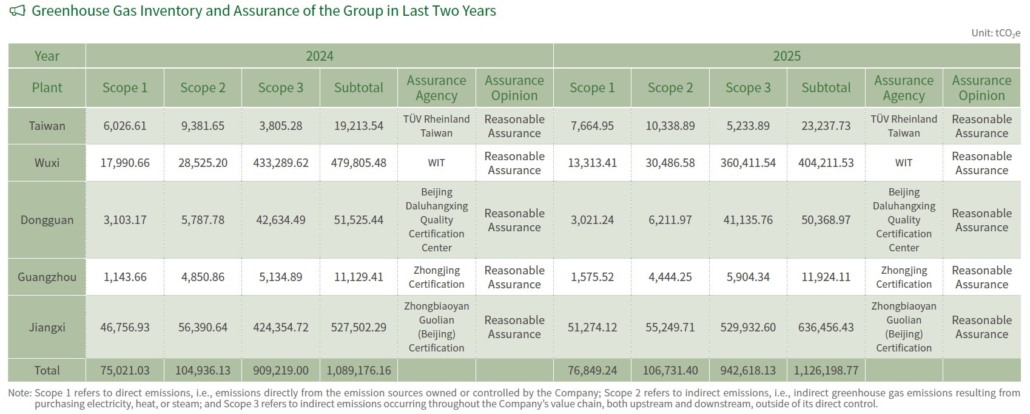
To fully understand the emissions of other indirect greenhouse gases and identify major emission sources to plan carbon reduction strategies, we calculated the emissions of other key indirect greenhouse gases in 2025 according to the ISO 14064:2018 standard, the product carbon footprint information network of the Ministry of the Environment, and the IPXX Sixth Assessment Report. In 2025, the emissions of other indirect greenhouse gases reached 942,618.14 tCO2e. The inventory results are shown in the following table. The greenhouse gas emissions from purchasing products and services were the highest.

Product: Prepreg (PP)
| Plant | Category | 2022 | 2023 | 2024 | 2025 | YoY Growth Rate in 2025 |
| Taiwan | Output (m) | 4,267,278 | 3,655,618 | 4,461,180 | 5,967,082 | 33.80% |
| Electricity (kWh/m) | 0.913 | 1.115 | 0.842 | 0.876 | 4.00% | |
| Natural gas (m3/m) | 0.257 | 0.333 | 0.350 | 0.36 | 2.80% | |
| Wuxi | Output (m) | 60,580,807 | 56,674,707 | 59,817,848 | 63,269,206 | 5.80% |
| Electricity (kWh/m) | 0.435 | 0.428 | 0.446 | 0.458 | 2.70% | |
| Natural gas (m3/m) | 0.051 | 0.047 | 0.048 | 0.048 | 0.00% | |
| Dongguan | Output (m) | 21,478,138 | 18,745,963 | 12,536,041 | 14,905,042 | 18.90% |
| Electricity (kWh/m) | 0.720 | 0.751 | 0.681 | 0.613 | -10.00% | |
| Natural gas (m3/m) | – | – | – | – | 0.00% | |
| Guangzhou | Output (m) | 18,795,813 | 16,592,175 | 5,021,242 | Not produced | – |
| Electricity (kWh/m) | 0.262 | 0.306 | 0.508 | Not produced | – | |
| Natural gas (m3/m) | 0.028 | 0.010 | 0.032 | Not produced | – | |
| Jiangxi | Output (m) | 43,800,278 | 49,371,729 | 63,467,398 | 89,246,213 | 40.60% |
| Electricity (kWh/m) | 0.734 | 0.784 | 0.791 | 0.563 | -28.90% | |
| Natural gas (m3/m) | 0.114 | 0.125 | 0.134 | 0.096 | -28.10% |
Product: Copper Clad Laminate (CCL)
| Plant | Category | 2022 | 2023 | 2024 | 2025 | YoY Growth Rate in 2025 |
| Taiwan | Production volume (sheet) | 1,228,319 | 860,814 | 907,941 | 1,431,726 | 57.70% |
| Electricity (kWh/sheet) | 3.707 | 4.192 | 4.751 | 4.283 | -9.90% | |
| Natural gas (m3/sheet) | 0.721 | 1.123 | 1.456 | 1.070 | -26.50% | |
| Wuxi | Production volume (sheet) | 15,885,912 | 14,093,188 | 15,899,071 | 18,661,951 | 17.40% |
| Electricity (kWh/sheet) | 1.659 | 1.720 | 1.679 | 1.562 | -7.00% | |
| Natural gas (m3/sheet) | 0.194 | 0.190 | 0.181 | 0.164 | -9.40% | |
| Dongguan | Production volume (sheet) | 6,842,430 | 5,792,569 | 2,882,430 | 3,612,403 | 25.30% |
| Electricity (kWh/sheet) | 1.217 | 1.308 | 1.595 | 1.363 | -14.50% | |
| Natural gas (m3/sheet) | 0.277 | 0.362 | 0.348 | 0.377 | 8.30% | |
| Guangzhou | Production volume (sheet) | 3,206,553 | 387,026 | Not produced | Not produced | – |
| Electricity (kWh/sheet) | 1.535 | 7.362 | Not produced | Not produced | – | |
| Natural gas (m3/sheet) | 0.167 | 0.465 | Not produced | Not produced | – | |
| Jiangxi | Production volume (sheet) | 8,963,128 | 13,310,418 | 18,893,673 | 20,059,129 | 10.30% |
| Electricity (kWh/sheet) | 3.587 | 2.907 | 2.657 | 2.504 | -5.80% | |
| Natural gas (m3/sheet) | 0.557 | 0.465 | 0.450 | 0.428 | -4.80% |
Product: Flexible Copper Clad Laminate (FCCL)
| Plant | Category | 2022 | 2023 | 2024 | 2025 | YoY Growth Rate in 2025 |
| Guangzhou | Production volume (sheet) | 6,768,257 | 8,762,559 | 11,643,628 | 13,169,428 | 13.10% |
| Electricity (kWh/sheet) | 0.644 | 0.649 | 0.727 | 0.767 | 6.10% | |
| Natural gas (m3/sheet) | 0.041 | 0.034 | 0.026 | 0.030 | 15.40% |
Note 1: Electricity consumption of each plant was calculated according to the average energy density per month; electricity consumption of the Guangzhou Plant was 100% allocated to FCCL (in 2024, electricity was allocated to PP and FCCL processes at ratios of 23% and 77% respectively).
Note 2: Natural gas consumption of the Taiwan Plant was allocated to PP and CCL processes at ratios of 25.2% and 74.8% respectively; natural gas consumption of the Wuxi and Jiangxi Plants was allocated to PP and CCL processes at ratios of 22.6% and 77.4% respectively; natural gas consumption of the Dongguan Plant was 100% allocated to the CCL process; and natural gas consumption of the Guangzhou Plant was also 100% allocated to FCCL (in 2024, natural gas consumption was allocated to PP and FCCL processes at ratios of 35% and 65% respectively).
Energy-saving and Carbon Reduction Measures and Effect
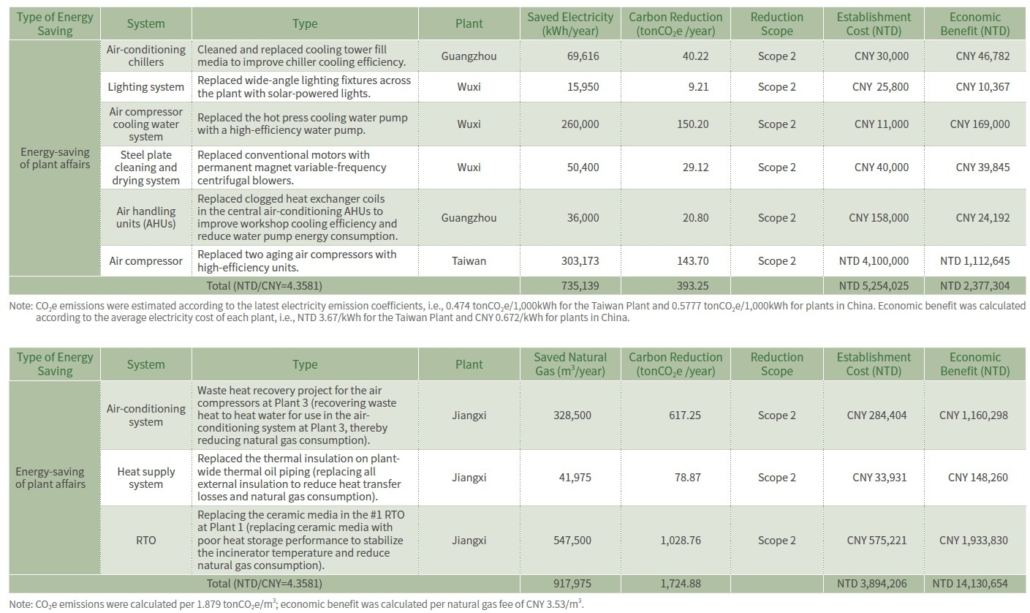
ITEQ continually improves the energy efficiency of its plants through various energy-saving measures. In 2025, the Group implemented nine energy-saving initiatives, achieving a total emission reduction of 2,118.13 tCO2e. Details and achievements of energy-saving measures are shown in the following tables:
ISO 50001:2018 Energy Management System
The Jiangxi plant was certified by the ISO 50001 Energy Management System in 2019. We further realized energy efficiency and reduction based on the ISO system, and discussions continue to explore alternative energy. At present, three plants among five plants in this report passed the certification of ISO 50001:2018 Energy Management System. The other plants will subsequently pass the certification according to the system provisions.
| Plant | Wuxi Plant | Taiwan Plant | Jiangxi Plant |
| First issuance of certification | 2019.12.23 | 2020.11.12 | 2023.02.20 |
| Validity date of certification | 2025.12.22 | 2026.11.12 | 2026.02.19 |
| Assurance agency | WIT | SGS | GZCC |